Mapping Cyber Attacks Worldwide
Deployed a cloud-based SIEM solution using Azure Sentinel to monitor worldwide cyber attacks. Configured a vulnerable Windows VM as a honeypot with open inbound traffic, then integrated Log Analytics to capture security events. Custom PowerShell scripts processed failed RDP attempts (Event ID 4625), enriching logs with attacker geolocation data via API calls. Created custom logs in Azure to visualize attack origins on a world map, demonstrating hands-on experience with:
• SIEM configuration & log ingestion
• Security VM deployment (intentional vulnerability)
• Geo-IP mapping & attack pattern analysis
Technical Process:
Disabled Windows Firewall to attract attacks
Developed automated script (PowerShell ISE) to extract attacker IPs/countries
Built custom "FAILED_RDP_WITH_GEO" logs in Log Analytics
Visualized global threats in Sentinel using latitude/longitude mapping
Credit: Inspired by Josh Madakor's SIEM tutorial methodology
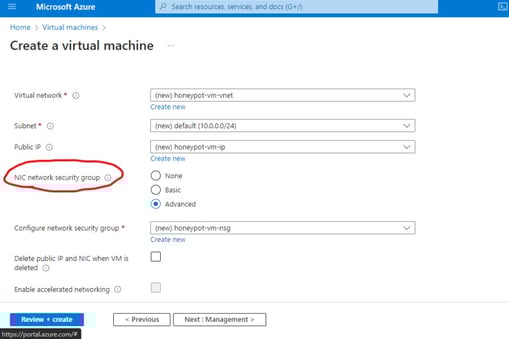
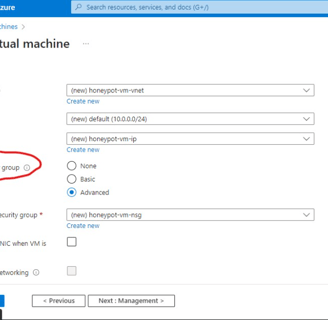
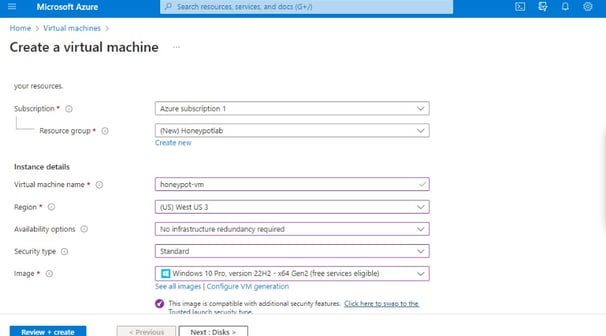
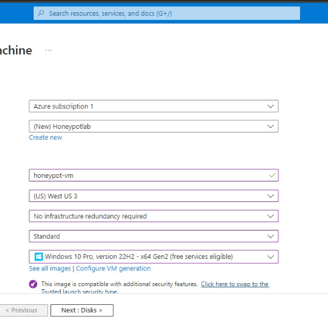
1. Deploying VM for Global Attacks: Establishing a Cyber Honeypot
To begin, the process involves setting up a Virtual Machine (VM) intentionally exposed to the internet, inviting global attempts at infiltration once online. Subsequently, a honeypot is constructed to facilitate the implementation of countermeasures against potential threats. The Network Security group is then established, configuring inbound internet traffic to flow freely into the VM, a practice typically discouraged but essential for gaining insights into the diverse methods of cyber attacks, ranging from TCP pings to ICMP scans.
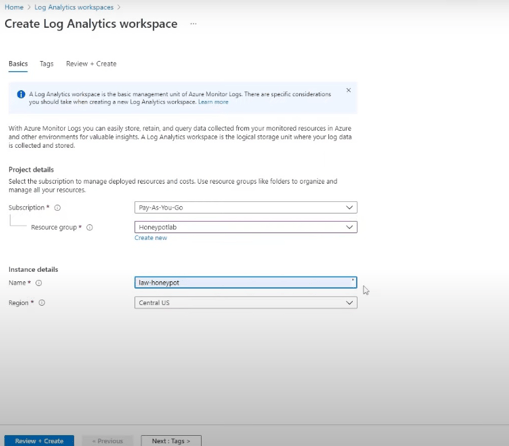
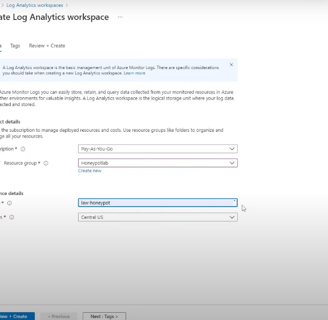
2. Setting Up Log Analytics and VM Integration for Threat Detection
Our focus is on building a robust infrastructure for log management and analysis. We start by creating a Log Analytics Workspace, the central hub for storing logs. This serves as the foundation for our SIEM tool, Azure Sentinel, allowing us to visualize geodata on a map for improved threat intelligence. We then configure Microsoft Defender for Cloud to gather VM logs and direct them to the Log Analytics Workspace, ensuring comprehensive data capture. Finally, we establish connectivity between the Workspace and our VM to optimize threat detection.
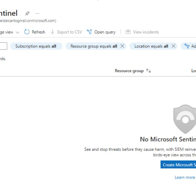
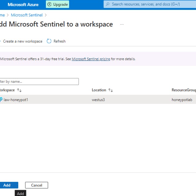
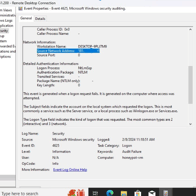
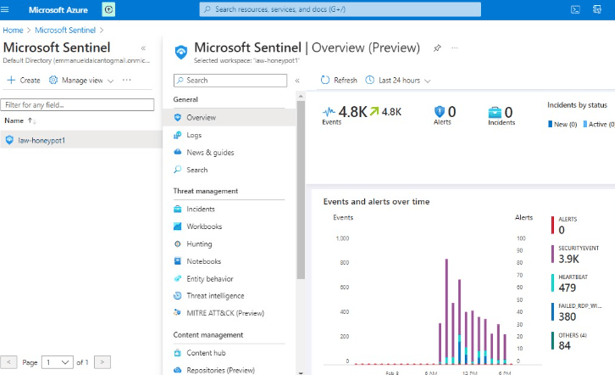
3. Azure Sentinel Configuration
In configuring Azure Sentinel, we streamline the setup of Microsoft Sentinel, our SIEM tool, to visualize attack data effectively. Beginning with Microsoft Sentinel creation, we integrate it into our workspace, consolidating log analytics for streamlined analysis. We focus on Event ID 4625, tracking failed login attempts, and leverage IP addresses for geolocation data to pinpoint attackers’ locations. This information is used to create a custom log, ingested into Azure’s Log Analytics Workspace and Sentinel. With Latitude, Longitude, and Country data, we accurately plot attackers on a map for enhanced threat detection.
4. Disabling Windows Firewall for Enhanced Internet Accessibility
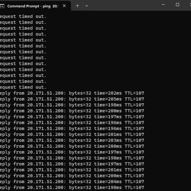
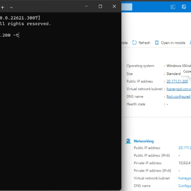
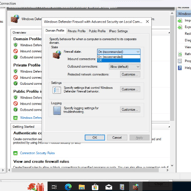
In this step, we focus on turning off the Windows Firewall on our VM to facilitate faster internet discovery. By disabling the Firewall, we enable ICMP echo requests, essential for internet connectivity and discovery. After confirming the connectivity issue with a timed-out ping, we proceed to disable the Firewall settings, including Domain, Private, and Public Profiles. With echo requests now permitted, the ping successfully resumes, ensuring improved accessibility for internet-based activities, for this step we will open our Command Prompt from our computer (not VM) and use the following: ping “IP from our Public IP Address” -t
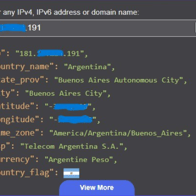
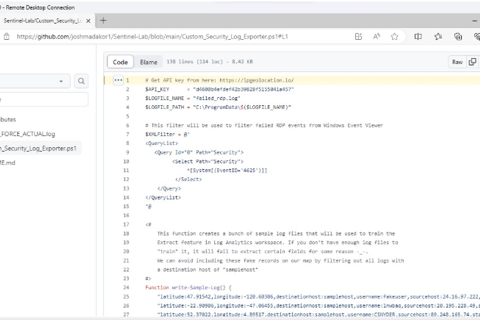
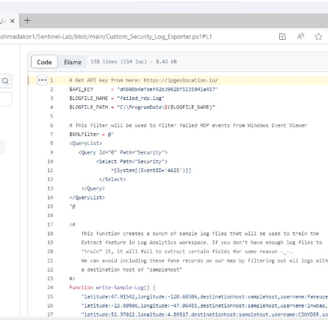
5. Downloading and Configuring PowerShell Script for Geo Data Extraction
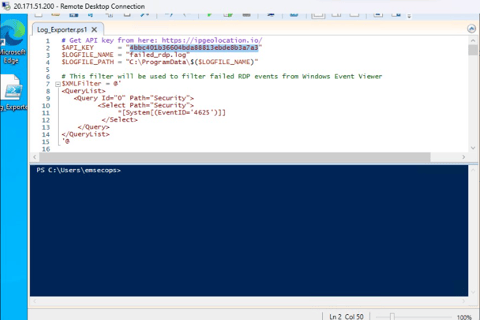
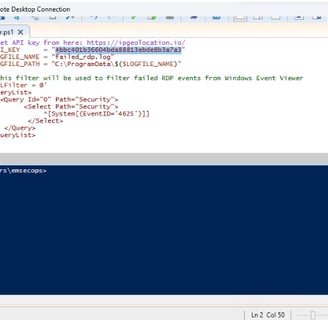
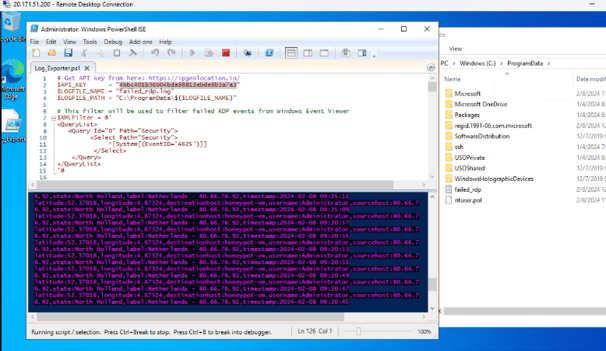
In this step, we download a crucial PowerShell Script from a trusted source, Josh Madakor, via GitHub. The script, “Custom_Security_Log_Exporter.ps1,” is essential for extracting geographic information from logs. Following the download, we open Windows PowerShell ISE on the VM, create a new script, and paste the downloaded code. The script is saved as “Log_Exporter” on the Desktop for easy access. Additionally, we obtain an API Key from Geolocation.io, ensuring access to geo data in the script. This key is inserted into the script to enable accurate geographic data extraction. By completing these actions, we ensure the script’s readiness for extracting essential geo data from logs for further analysis.
6. Executing Script for Geo Data Retrieval from Attackers
In this phase, we execute a critical script designed to retrieve geographic data from potential attackers. The script operates continuously in a loop, scanning the security log for failed login attempts. Upon detection of such events, it extracts the IP addresses associated with the failed logins and fetches their corresponding geographic data. Subsequently, the script generates a new log file containing this information. The output log file is stored at a specified path, facilitating easy access for further analysis. By executing this script, we establish a mechanism for continuously monitoring and logging failed login attempts, thereby enhancing our ability to identify potential threats and their geographic origins.
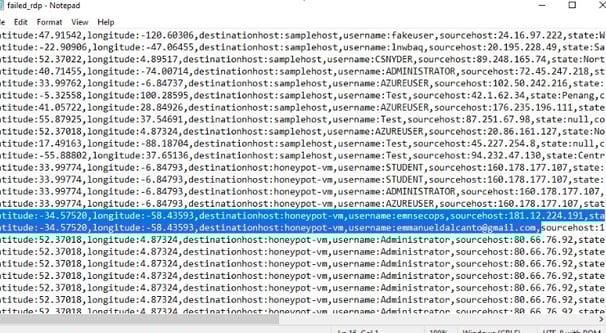
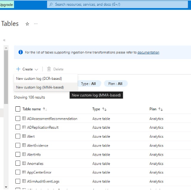
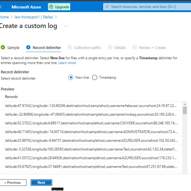
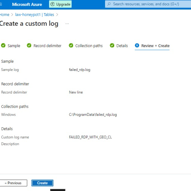
7. Creating Custom Log in Log Analytics Workspace
This stage involves creating a custom log within the Log Analytics Workspace to facilitate the integration of specific log data, including geographic information, into our analytics platform. We begin by navigating back to the Log Analytics Workspace on Azure and selecting our designated Honeypot. From there, we proceed to create a custom log tailored to our requirements. The process involves copying the relevant logs from the VM and storing them in a new notepad file named “failed_rdp.log.” Subsequently, we specify the collection path for the log file and provide essential details such as the log name (“FAILED_RDP_WITH_GEO”). After creating the custom log, we may need to wait briefly for it to be fully processed. Once completed, we can access the custom log entries within the Log Analytics Workspace, enabling seamless integration of the specified log data for analysis and visualization.
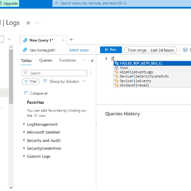
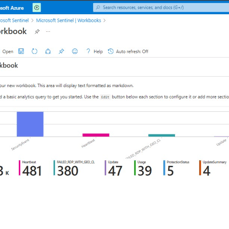
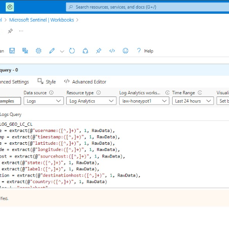
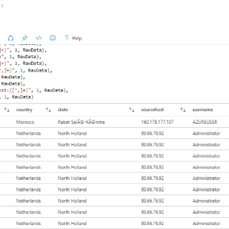
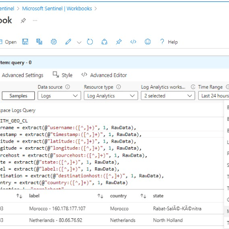
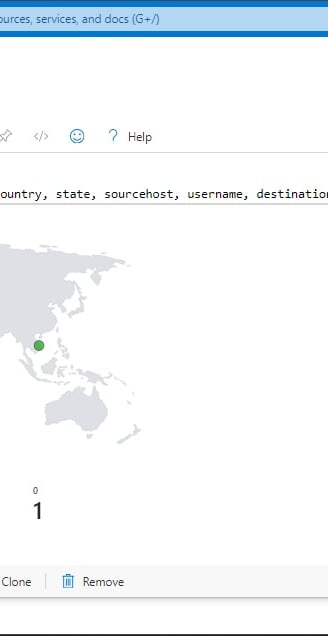
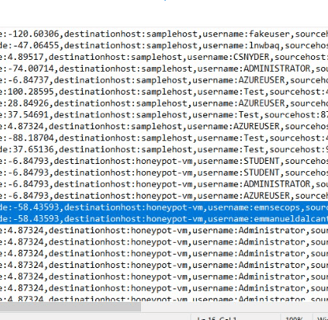
8. Extracting Fields from Raw Custom Log Data
This step focuses on extracting essential fields from raw custom log data to enhance the analytical capabilities of our Log Analytics Workspace. Initially, we utilize specific code, which can be found on our GitHub repository, to extract all relevant data from the logs. This process enables the creation of distinct fields such as latitude, longitude, username, and country. As a result, when reviewing the log file within our VM, these extracted fields will be clearly delineated, facilitating easier interpretation and analysis. Subsequently, we navigate to our Log Analytics Workspace to observe the organized data, now separated into tabs for improved visibility and accessibility. Additionally, we open a new tab to overview our Microsoft Sentinel, where incoming logs can be observed, indicating successful data extraction and integration.
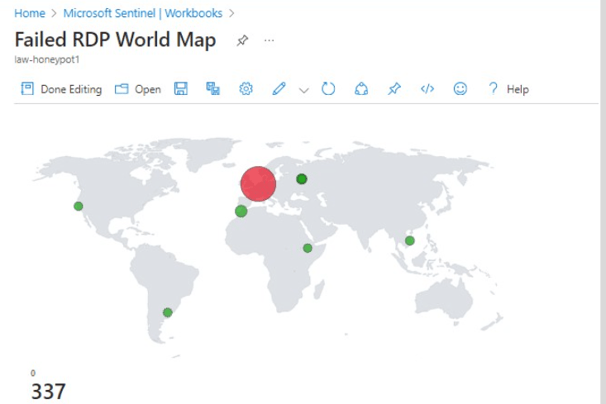
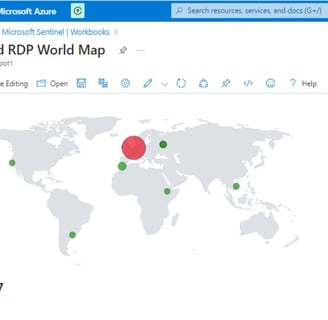
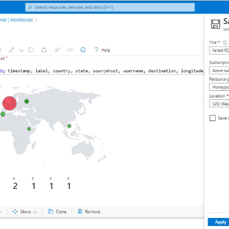
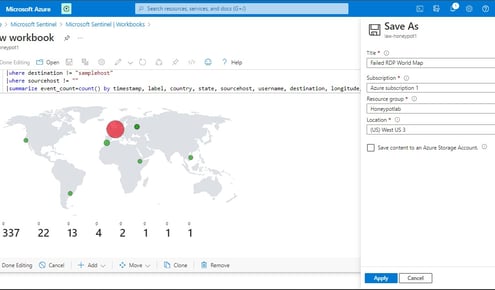
Final stage: Mapping Geographic Data in Sentinel
This last stage involves setting up a map visualization within Microsoft Sentinel to plot geographic data using latitude and longitude coordinates or country information. Initially, we create a workbook within Sentinel to organize and display our data effectively. Subsequently, we remove unnecessary widgets and execute a query by pasting previously used code. Upon running the query, we generate a visualization, selecting the map option to represent the geographic distribution of our data. This visualization provides valuable insights into the geographical origins of detected threats, enhancing our ability to analyze and respond to security incidents effectively.